California’s renewable energy records continue to fall by the wayside
 Last month California’s Independent System Operator (ISO) recorded multiple records for the amount of electricity renewable energy supplied to the California grid. They’re already being broken this month. The falling records shows just how much and how quickly solar and wind are growing in the Golden State.
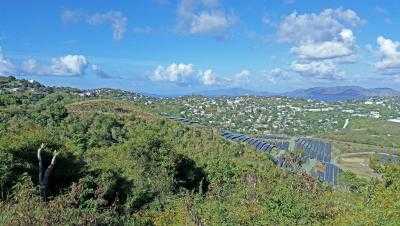
The ISO is the company charged with managing California’s high-voltage grid lines and controlling how much electricity is on those lines to meet demand. This past June the ISO reported that solar continued to break records throughout June, starting around June 8, when the amount of solar produced by solar utility projects reached 849 megawatts (MWs), which was roughly 2.7 percent of the state’s demand at that moment, according to the North County Times. In the first few days of July, the state blew that away, producing more than 100 megawatts more, reaching 965 MWs on July 2, which was roughly 2.8 percent of the demand at that time.
“Those are production peaks,” said ISO spokesperson Steven Greenlee. “We’ve had some excellent sunny days this year, and also the production day is longer in the summer. We expect that number to rise,” he said. The ISO also is seeing more solar power coming online this summer with some big projects pushing more renewable energy online.
Last month wind generation also saw a new high in California. Turbines in the state produced 3,346 MWs on June 30, according to Greenlee. While the solar was pushing electrons out at the peak of the day, the wind turbines pushed them out in the middle of the night, peaking around 2 AM and representing nearly 14 percent of the grid’s usage at the time.
Still, the higher percentages of renewables on the grid and their variability hasn’t affected the grid’s stability. “I don’t believe we have had any difficulties in the traditional sense of the word,” Greenlee said. “There are always challenges to deal with number of megawatts coming in on the grid from variable resources. They are challenging because of their variability. But we have not had any difficulty,” he said.
While the number reported reflected how much utility-scale, straight-to-the-grid projects produced, it did not reflect how much more solar power was generated by residential and commericial net-metered projects, according to Greenlee. “We don’t see residential. It’s behind the meter,” he said. While the ISO runs the high-voltage network, the utilities run the networks as they are distributed to customers. As the number of customers with onsite solar grows, the ISO would like to see how much the approximately 1,100 MWs of installed systems are producing. But at this point it can’t see how much they are generating.